Global container demand grew a steady 6.5% in 2021
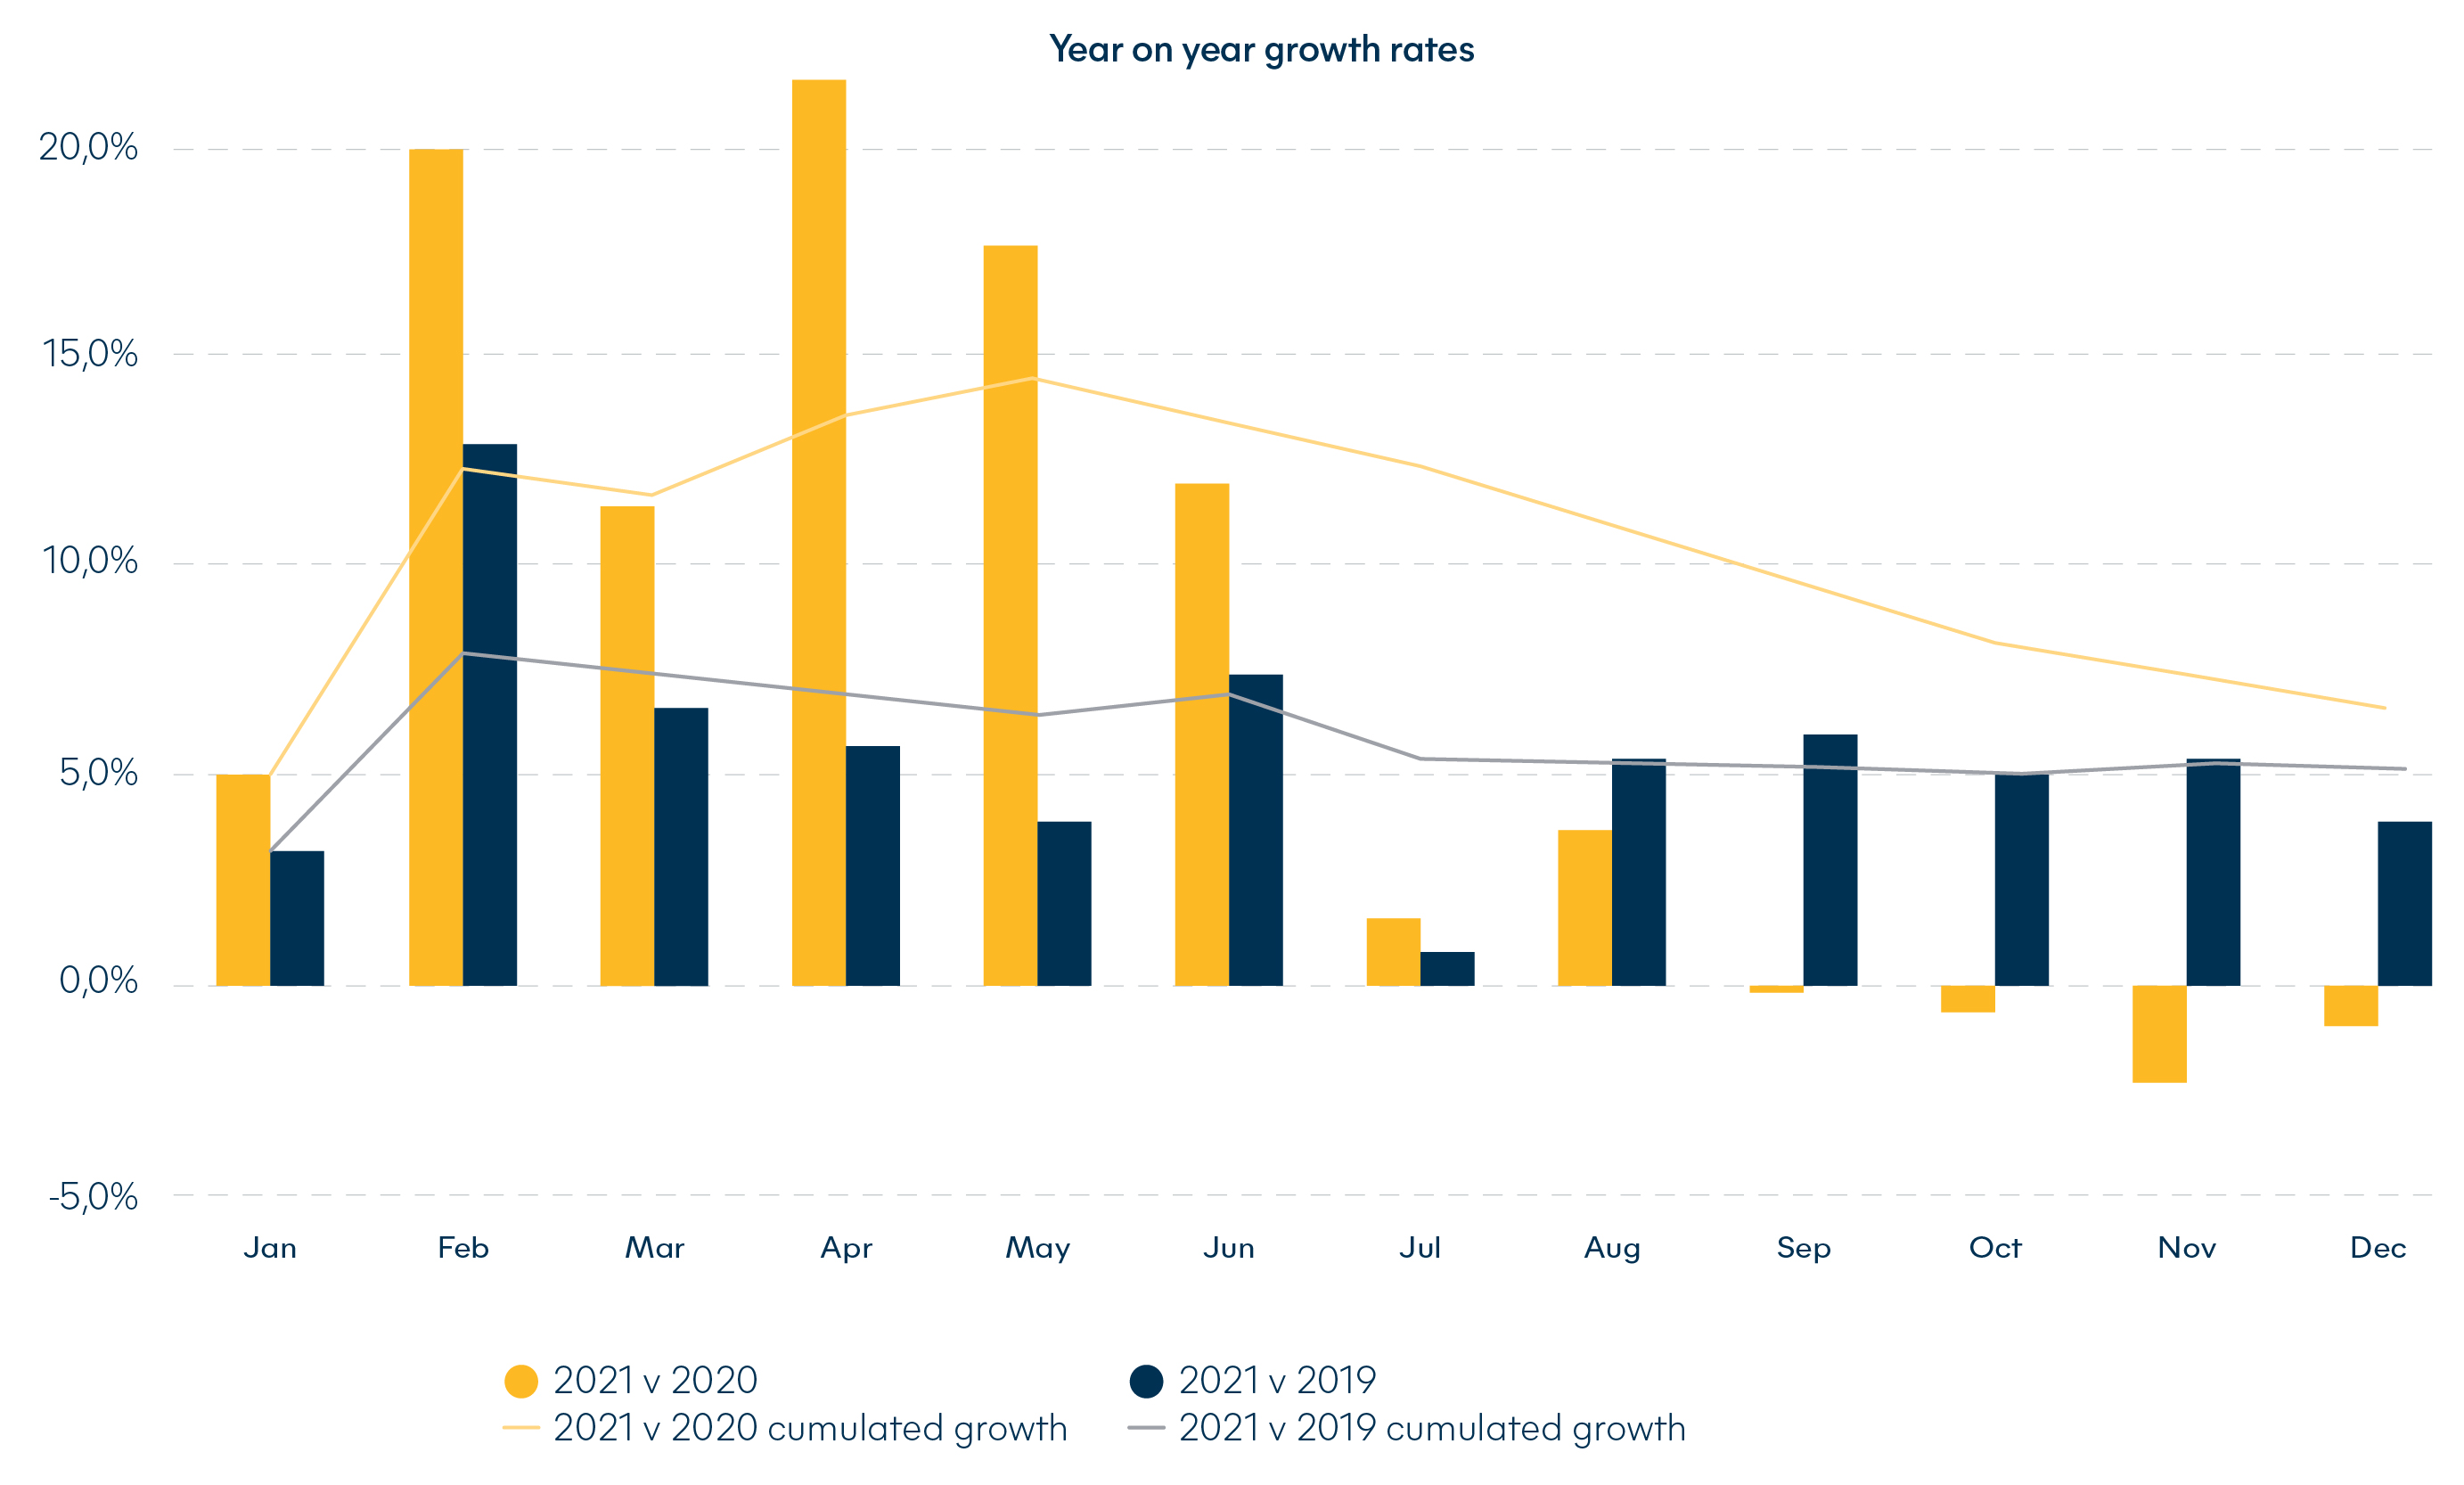
After the first semester recorded a 14% YoY growth, demand certainly slowed down.
Global shipping schedule reliability fell below 35% in 2021 and international freight shippers have faced unheard of operational disruption all year long. This disruption unfortunately shows little sign of easing in 2022 and has caused lead times to dramatically increase on most trades.
Shipping lines are expected to collectively generate USD180bn in 2021
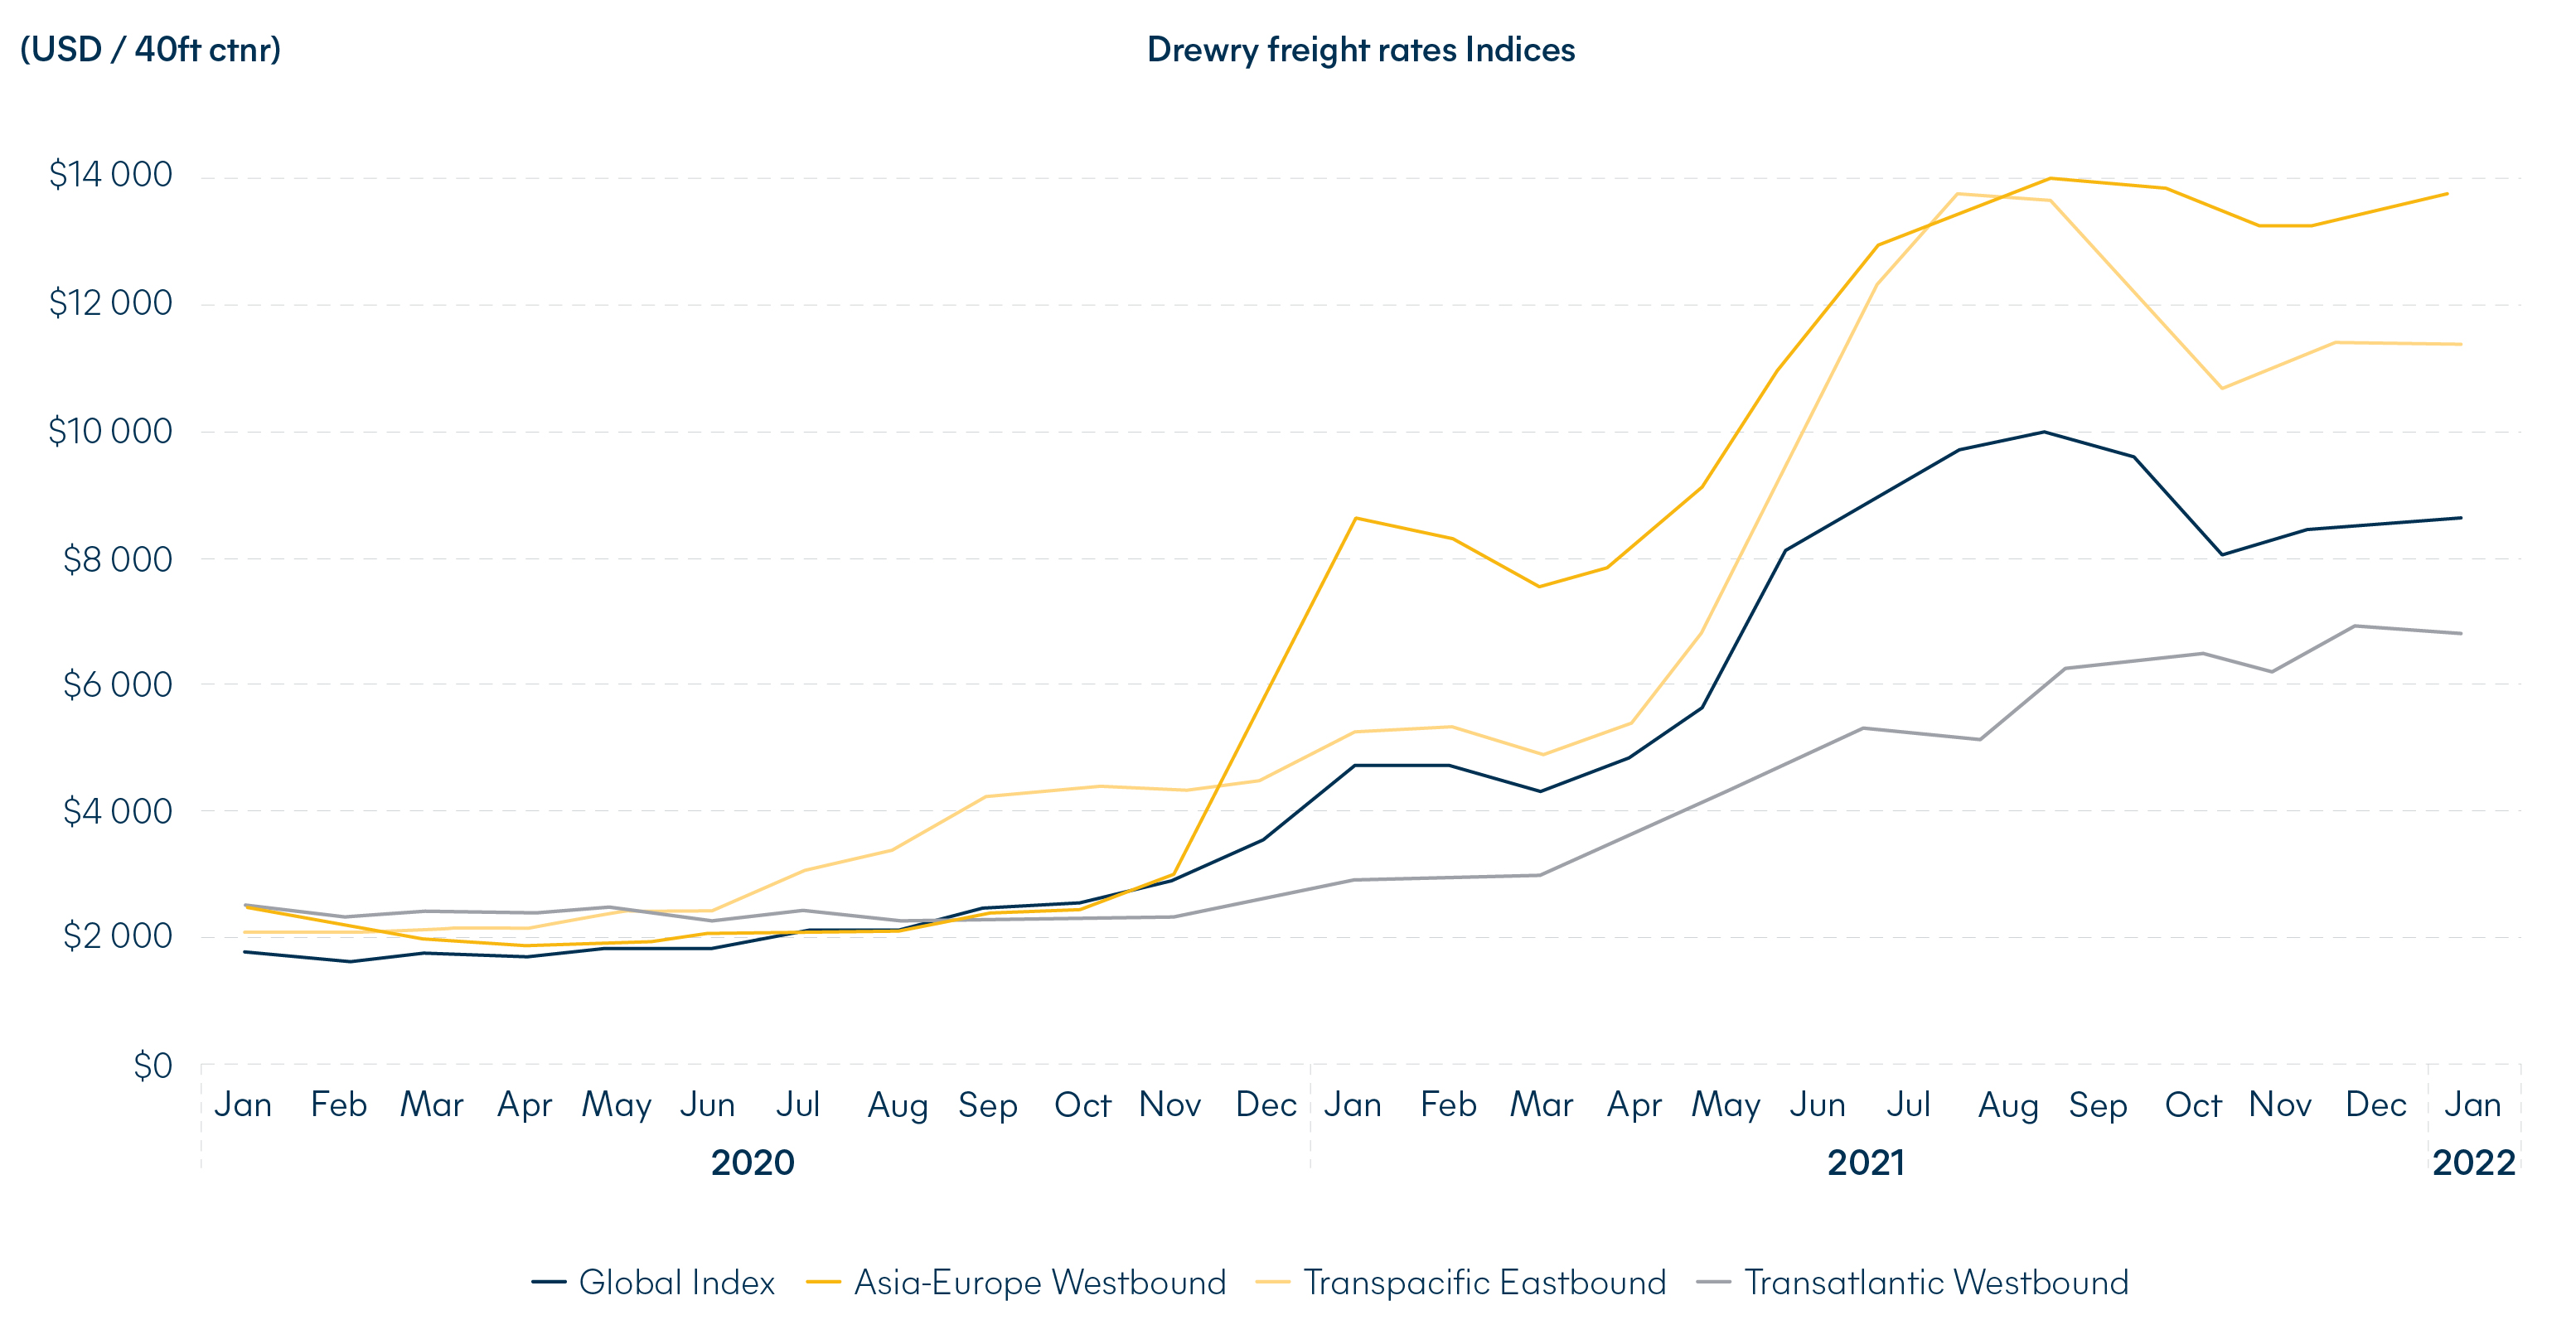
Ocean freight rate levels reached record highs on all routes and remain steady.
Through all the chaos, congestion, fight for space on vessels and the hunt for containers, ocean freight carrier profits are booming on the back of the unprecedented supply/demand conditions. This will enable further investment into future fleets and greener technologies.
Global container capacity reached 25 million TEUs by end December 2021
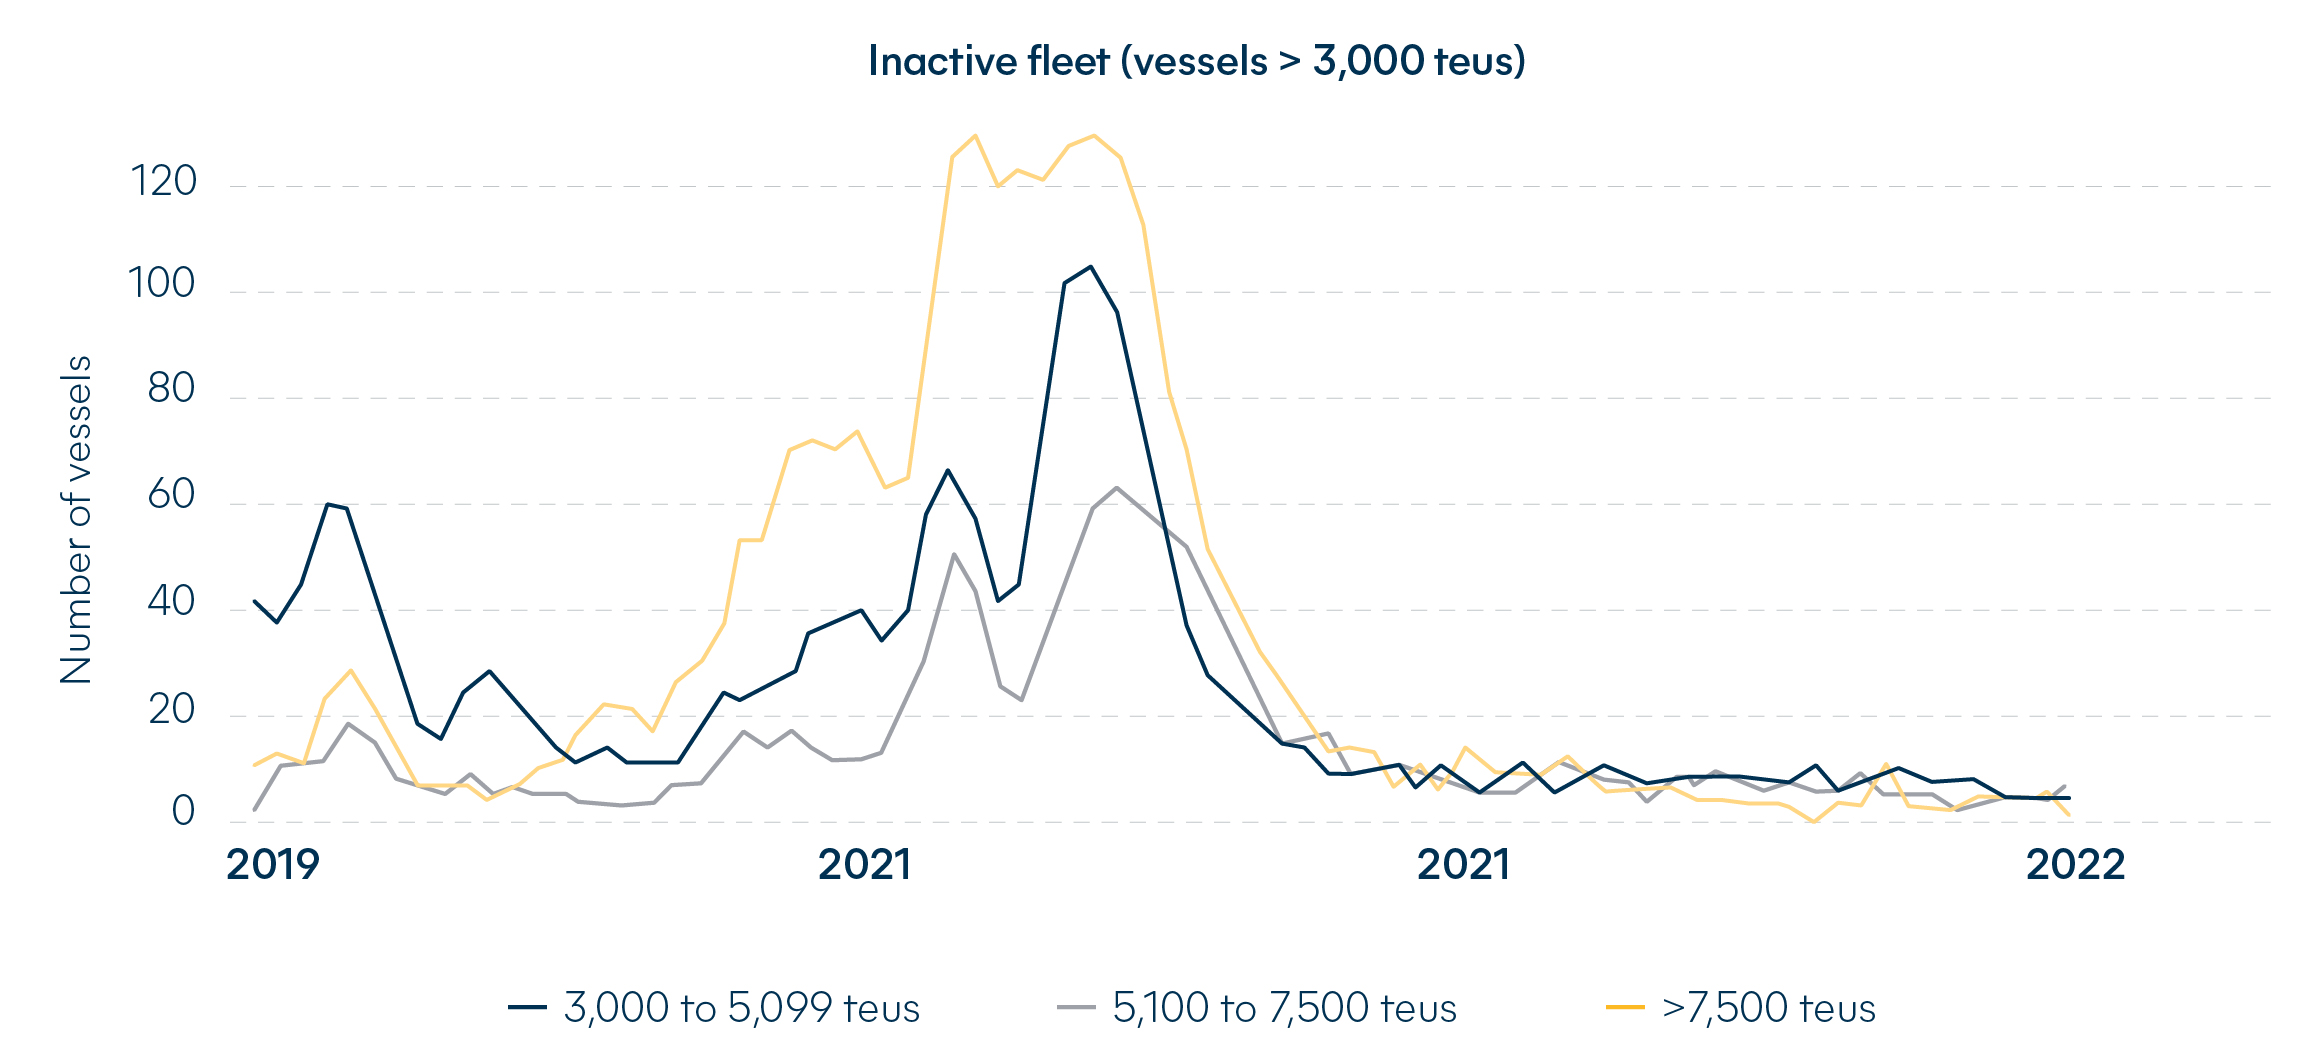
This is the largest worldwide container capacity available EVER! Ocean cargo carriers did react to the demand, making use of every vessel available, cutting the unused global fleet to a record low below 1%.
However, ocean carriers also focused on deploying container vessels on the strongest demand routes, starting with the Transpacific, where capacity grew 31%. By domino effect, this impacted other less lucrative lanes, which did not receive such a capacity influx.
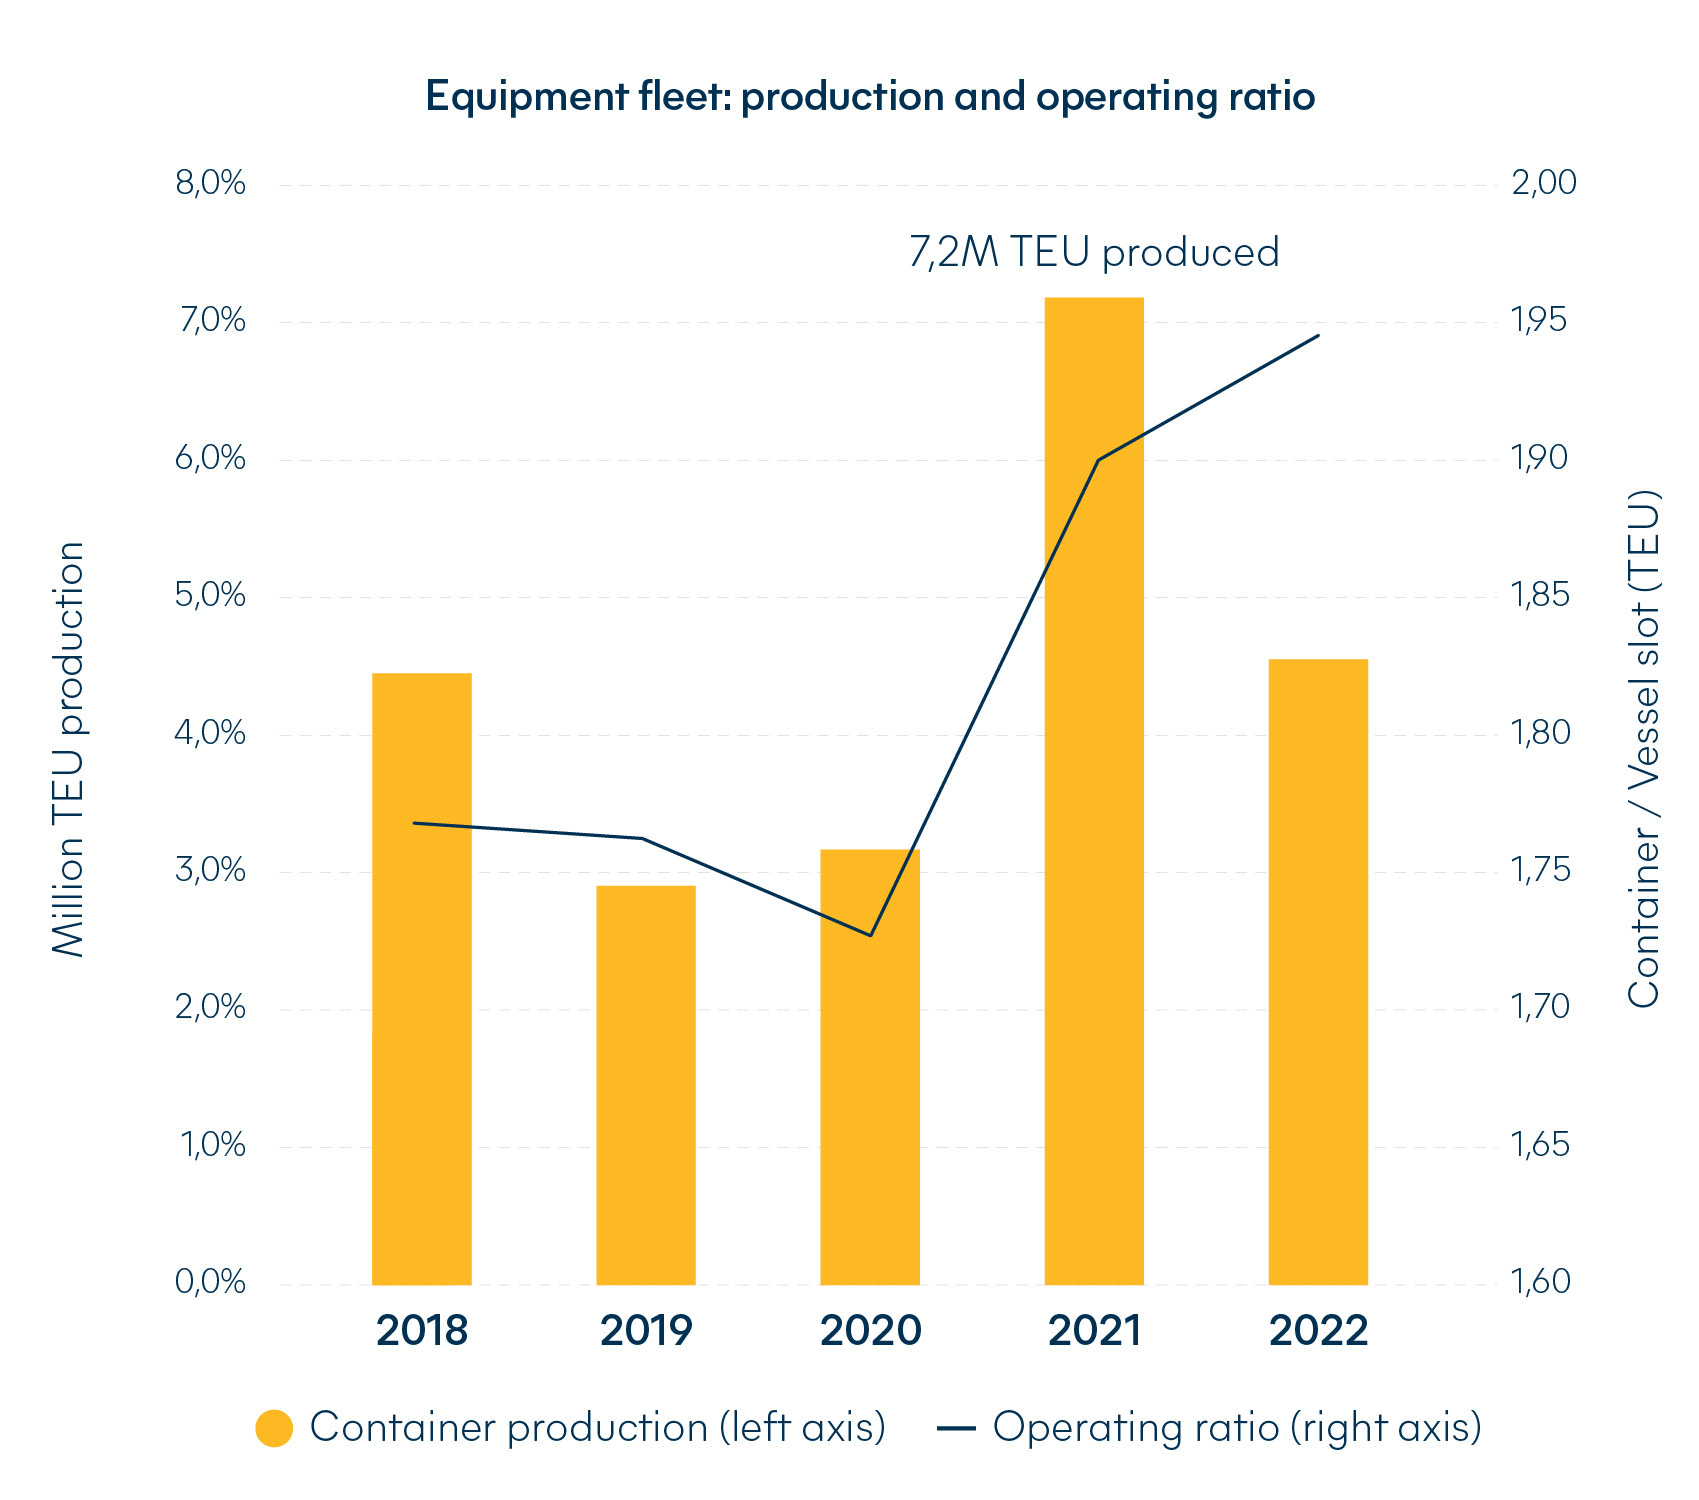
Besides solid equipment production in 2021 primarily ordered by ocean carriers, the actual ratio of available TEUs per slot remains low. It’s also unlikely to improve by much, due to poor equipment turn-around time. There’s also a large difference between back and headhaul freight rates, as freight cargo carriers prioritize empty container repositioning over full loads.
Congestion and delays continue, as does the lack of equipment availability
If you thought it couldn’t get worse for US intermodal networks, think again. Bottlenecks continue, worsening congestion at ports, with vessel waiting times around 15 to 20 days in many ports.
In H2 2021 port congestion prompted carriers to drop 25% of all North Europe calls (400 port calls) on their Far East loops. By the end of December, around 13% of the world’s capacity was made ineffective by delays. That’s like removing the equivalent of CMA CGM’s entire fleet!
Speaking of fleets… The new vessels order book accounts for 6 million TEU, or 23% of the existing global containership fleet. However, 2022 deliveries are set at around 1 million TEUs, which is around 4.5% of the existing fleet.
Hillebrand is here to help answer your questions, work through your challenges and get your cargo moving. How can we help you?
Download the full report here

Read the questions, answers and advice shared by Hillebrand's Freight Procurement Director